Climate and Weather Charts
Honolulu International Airport (HNL)
(Honolulu, Hawaii - HI, USA)
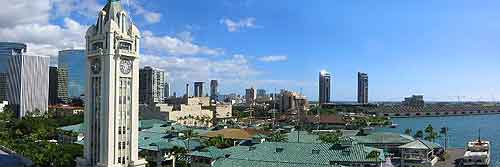
Honolulu features a marine, tropical climate with picturesque stretches of sandy beaches and palm trees to match. Sunshine is always plentiful in Honolulu, which is home to typically Hawaiian weather.
The weather and climate in Honolulu is constant, with very little fluctuation in temperatures. July, August and September tend to be the hottest months, averaging around 31°C / 88°F, while December and January are usually the coolest, with average temperatures of 27°C / 81°F. Levels of precipitation on Honolulu are rarely excessive although occasional heavy spells of rain are most likely during from November through April. The average annual daytime temperatures in Honolulu are around 29°C / 85°F.

Climate Description: Marine, tropical climate
Honolulu Airport (HNL) Location: Northern Hemisphere, USA, Hawaii
Annual High / Low Daytime Temperatures at Honolulu: 31°C / 27°C (88°F / 81°F)
Average Daily January Temperature: 27°C / 81°F
Average Daily June Temperature: 30°C / 86°F
Annual Rainfall / Precipication Honolulu at Airport (HNL): 556 mm / 22 inches
Honolulu Airport (HNL):
Climate and Weather Charts
Temperature Chart |
| Temperatures |
Jan |
Feb |
Mar |
Apr |
May |
Jun |
Jul |
Aug |
Sep |
Oct |
Nov |
Dec |
Average |
Maximum
Celcius (°C) |
27 |
28 |
28 |
29 |
29 |
30 |
31 |
31 |
31 |
30 |
29 |
27 |
29 |
Minimum
Celcius (°C) |
19 |
19 |
19 |
20 |
21 |
22 |
23 |
23 |
23 |
22 |
22 |
20 |
21 |
Maximum
Fahrenheit (°F) |
81 |
82 |
82 |
84 |
84 |
86 |
88 |
88 |
88 |
86 |
84 |
81 |
85 |
Minimum
Fahrenheit (°F) |
66 |
66 |
66 |
68 |
70 |
72 |
73 |
73 |
73 |
72 |
72 |
68 |
70 |
Rainfall / Precipitation Chart |
| Rainfall |
Jan |
Feb |
Mar |
Apr |
May |
Jun |
Jul |
Aug |
Sep |
Oct |
Nov |
Dec |
Total |
| Rainfall (mm) |
89 |
56 |
56 |
38 |
28 |
13 |
15 |
10 |
20 |
58 |
76 |
97 |
556 |
| Rainfall (inches) |
3.5 |
2.2 |
2.2 |
1.5 |
1.1 |
0.5 |
0.6 |
0.4 |
0.8 |
2.3 |
3.0 |
3.8 |
22 |
| Honolulu Days of Rain |
9 |
9 |
9 |
9 |
7 |
6 |
7 |
6 |
7 |
9 |
9 |
10 |
97 |
Seasonal Chart |
| Seasons |
Average
Temp
(Max °C) |
Average
Temp
(Min °C) |
Average
Temp
(Max °F) |
Average
Temp
(Min °F) |
Total
Rainfall
(mm) |
Total
Rainfall
(inches) |
| Mar to May (Spring) |
29 |
20 |
83 |
68 |
122 |
5 |
| Jun to Aug (Summer) |
31 |
23 |
87 |
73 |
38 |
2 |
| Sept to Nov (Autumn / Fall) |
30 |
22 |
86 |
72 |
154 |
6 |
| Dec to Feb (Winter) |
27 |
19 |
81 |
67 |
242 |
10 |
